Inside Pigment: Optimizing Infrastructure Costs with Our Own Tools
Pigment is not even 5 years old, yet our R&D team has reached a FinOps maturity stage we are already proud of. Thanks to our own product, we enable cross functional use cases that serve finance, sales, and tech teams throughout our customer lifecycle.
FinOps @Pigment R&D
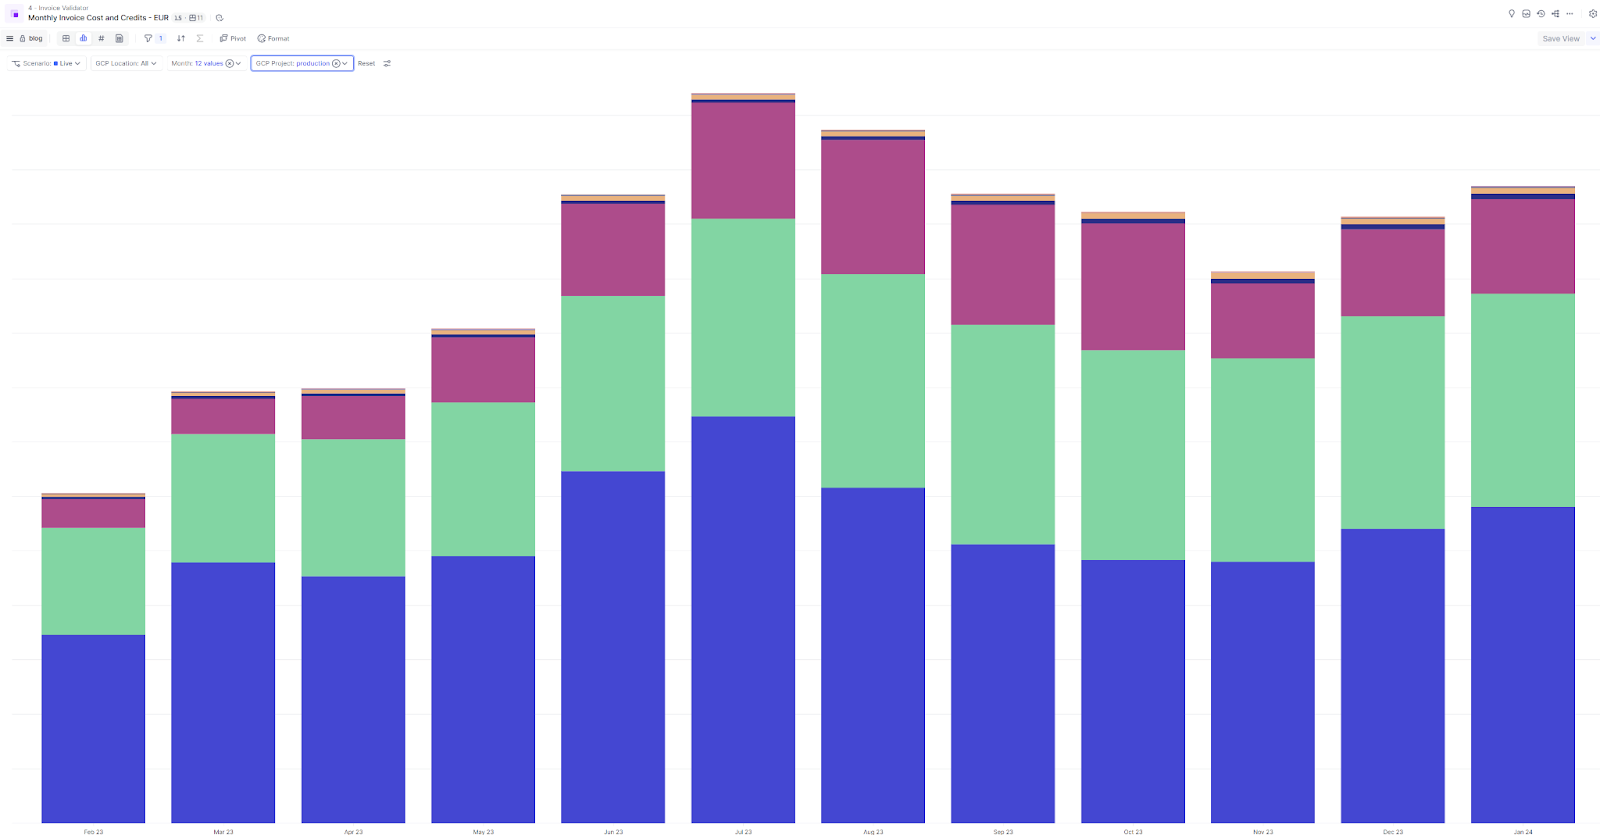
Today, a Pigment application fully calculates the lines of our infrastructure invoice automatically, covering our cloud provider and third party software bills. As a FinOps team, we reconcile this data with the official invoice at the end of every month, and drill down into necessary details, down to the day and the SKU level. We also monitor the cost of every individual Pigment customer, over time and based on their platform usage. Finally, we follow-up on operational KPIs together with our engineers so we detect and fix bad trends, and monitor whether we need to renew cloud commitments.
We do this entirely in our own product, Pigment, supported by custom developments made by our Site Reliability Engineering team.

How it started
Does such an advanced model really make sense at this stage? Indeed, a startup has to grow fast. To release and scale the product as fast as possible, our engineers need to spawn environments, to log traces, to size up our infra, in an almost limitless fashion. As they do so, many things can be overlooked. It may be technical debt, clean processes, but also, the cash we spend. Yet, funding has gone through a major crisis lately. Raising more money when it runs out is no longer an option at most companies. Growth needs to be controlled, more than was necessary perhaps 2 years ago.
How do we plan and achieve a reasonable level of control in an engineering team whose ability to work well and fast is at the heart of the company's success? At Pigment, we are never driven by “doing things by the book”. We are constantly driven by pragmatism, and pragmatism relies on framing the right problems to solve.
Indeed, what our management asked our R&D team wasn’t initially to get better at monitoring our costs. It was rather about understanding what a specific customer implementation costs the company. This precious knowledge has been the starting point to help us solve multiple problems at once.
What problems did we need to solve?
Firstly, calculate profitability. Comparing infra cost and direct support cost to annual recurring revenue of a given customer, we can then estimate how profitable its current implementation is. Technical or customer success teams can then take multiple actions to optimize this profitability, such as reviewing a client’s data model, or analyzing whether their usage is still cost efficient.

Secondly, determine pricing. To estimate the cost of a given client’s infrastructure, once it is live with Pigment, our FinOps team looks at different data points. For instance, we determine allocation keys to attribute the cost of mutualized resources to individual customers, based on their platform usage. Could we reuse these data points to scope new deals, that is, to find a pricing that meets our client’s interests while protecting our margin? The more data we have, the better our knowledge: our FinOps team can support our business teams to price deals accordingly, early on in our company’s life.
Finally, support forecasting. There are 3 questions our FinOps team needs to answer on a regular basis. These questions are like Russian dolls:
-
What we think we’ll do: this is our official yearly budget. In the first iterations, it will be very close to linearly scaling costs based on the forecasted business growth and adding a lot of contingency on top of it. But the goal is to get this forecast closer to our profitability targets over time.
-
What we hope we’ll do: this is the operational target we can set to engineering teams. While we may have planned contingencies at a financial level, we can be more ambitious by setting targets and reaping good news for our finance teams throughout the year, as we optimize the usage of our infrastructure. Hopefully, we don’t have as much contingency to add with every budgeting cycle.
-
What we say we’ll do: this is the spend we are ready to commit on to third parties, like cloud providers, in exchange for commercial returns like discounts. Our commitment level is a risk : it needs to be carefully assessed while preserving our partnerships.

When allocating the cost of mutualized resources (like a shared database) between customers, a first and reasonable strategy is to allocate it uniformly between the users of this resource: it is quick to implement, works well if you have the same usage from most customers.
The evident drawback is that if some clients have a much bigger usage of the resource than others, this allocation strategy will not reflect it.
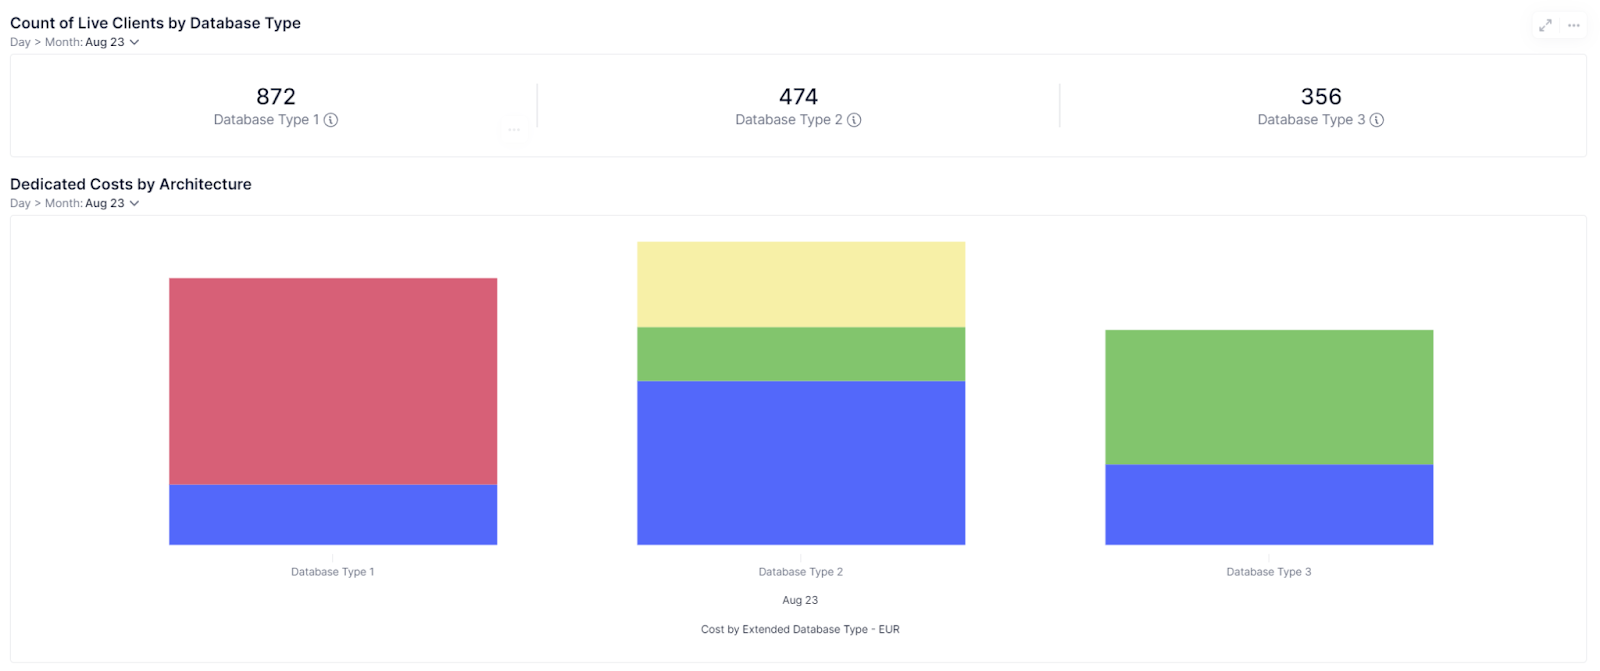
At Pigment, database costs are a significant part of our cloud costs. And clients have vastly different database workloads. This motivated us in building a more ambitious FinOps model to better track the cloud cost of each client.
To do so, nothing better than talking to the persons building Pigment, the developers, and the infrastructure team, in order to find a reasonable heuristic to allocate costs of shared resources.
The Pigment solution is many things, but from a low-level point of view, it executes jobs to process data.
When a job is completed, we retrieve its type, duration, the client and database host and export this data to BigQuery. Once this data is available in BigQuery, we can query it to estimate the ratio “client usage time” versus the “total usage time” of a database host: this ratio is used to allocate the cost of shared resources.
Does it allow us to allocate the cost from each client to the cent? No. Do we care? Still no!
It is a good enough approximation, giving us the precision we need to understand our cloud costs, without building an over-engineered solution that we will have to maintain.
Focus on forecasting: a cross functional effort
When we established our first baseline forecast, we realized only 40% of our total cost was truly influenced by the growth of our business. The rest was either rather constant, or scaling with other factors like our internal growth, such as our software engineers growing headcount. It was thus relatively easy to define targets for our engineering teams on the latter, for instance, to set a budget for our test environments.
On the other hand, when the cost is not easily predictable, typically, incurred by our customer’s usage and new deals coming up, then we can use different methods. We can apply a month-over-month growth as a baseline. But since we now have a cost per customer, along with other business metrics, we can work on more detailed scenarios.
Defining those scenarios, and revising them over time, is a cross-functional effort.
Engineering teams can complete theoretical numbers with a reality check. For instance:
- mutualize resources whenever possible so our infrastructure doesn’t grow linearly with the number of customers,
- use different storage classes so related costs do not explode with the volumes we store,
- limit how observability costs grow with traffic by leveraging log levels more. We once saved 10% of our Datadog costs with a single PR!
Defining related projects early on, even if we’ll execute them later in the year, helps us set operational targets and negotiate commercial agreements, while estimating a better contingency with finance.
With increased understanding of the relationship between business metrics and infra costs, customer facing teams take part in this too. For instance, pre-sales teams can add new questions in their deal assessment templates, so they gather from our prospects the business metrics that most influence cost. Should we put this data in Pigment, there would be a fully connected process from pricing to budgeting, and a feedback loop to revise their relationship over time.
Finally, we leverage commercial agreements to make our cost more predictable. It is much more profitable at some point to negotiate EULAs (End-User License Agreements) with third parties to cap our total cost rather than let it grow linearly along our business.
Using Pigment: a no brainer
The initial work on customer profitability could have been done with a spreadsheet and a couple of meetings, but it would have generated more work to repeat that exercise in the future. Moreover, it would have remained a work only a few people could do. At Pigment, we have scale at heart, and access to the most powerful FP&A solution on the market! For us as engineers, it was clear the data we worked on had to be published through repeatable processes, and made available in self service to the rest of the company, on a need-to-know basis. Building this entirely in the Pigment product was a no-brainer, especially as other teams made the same move, opening up opportunities to connect data together.
Today, our FinOps team reviews costs on a monthly basis with our Finance team. They used to contact our SRE lead directly in Slack DMs to get the information their job required! Thanks to the reports we built, they are now autonomous in reconciling invoices and fetching accounting data. The responsibility shifts to the left to the organization, preserving the focus of our engineers.
We also share those costs with the rest of the R&D team on a regular basis. When a team is accountable, being transparent only yields benefits. Our engineers have not changed their way of work : we don’t want to hurt our operational efficiency. But because our numbers are regularly made public, any software engineer can understand the impact of what they ship on the cost we are billed. Doing so generates engagement almost for free, already triggering numerous initiatives.
On top of everything, this is a unique opportunity for anyone in the R&D team to relate to our customers’ use cases, and realize the incredible potential of our product!

