Chasing performance drifts

You've probably been there. You switched from one tool to another because things got slow. Remember: Webpack, then RsPack or Vite? Jest, then Vitest? Bun? tsgo? Speed is why most of them exist. But performance isn't only a developer problem, our users feel it too.
The trouble with performance is that it drifts slowly. Nobody complains until the day they churn and move to a competitor. At Pigment, performance is in our DNA. We want the platform to stay fast, not just fast at day one.
This article is about how we protect our platform from performance regressions and how we chase performance drifts at Pigment.
We'll walk through three real regressions we caught and fixed. As with many performance regressions, they stayed invisible for a long time until they weren't anymore. For each one, we'll cover both the fix and the trap we set to make sure it could never silently come back.
Prefer watching over reading? This article is based on a talk — jump to the video at the end, it covers the same content.
Performance for everyone
Our users care about fast tools just as much as we do. They prefer a snappy interface over a sluggish one. But they don't measure bundle size or API response times, they experience your platform as a black box. They don't care if the backend is slow, as long as we can make the experience feel fast.
Many companies have measured the cost of slowness on their bottom line. In 2006, Google found that adding half a second to each search dropped traffic by 20% (More details here). Amazon found that 100ms of extra page load time cost them 1% in sales (More details here).
Performance clearly matters. But maintaining good performance is hard, for two reasons.
First, performance issues are everywhere. A recent study across 500 repositories found that 86% of them had memory leaks and by extension performance problems.
Second, it drifts silently. As engineers, do you still manually test against every browser? Against the slow machine most of your users actually have? On a slow network? When we build, we tend to forget that we're on powerful machines with fast networks and optimal setups. We rarely test against real production data as we often use trimmed-down datasets rather than ones that mimic the craziest real-world cases. Some regressions stay invisible to us. And it doesn't take a sweeping refactor to introduce one: a single line of CSS, a misplaced hook, a missing cleanup can silently flip a well-optimized experience into a sluggish one.
Defining performance scope
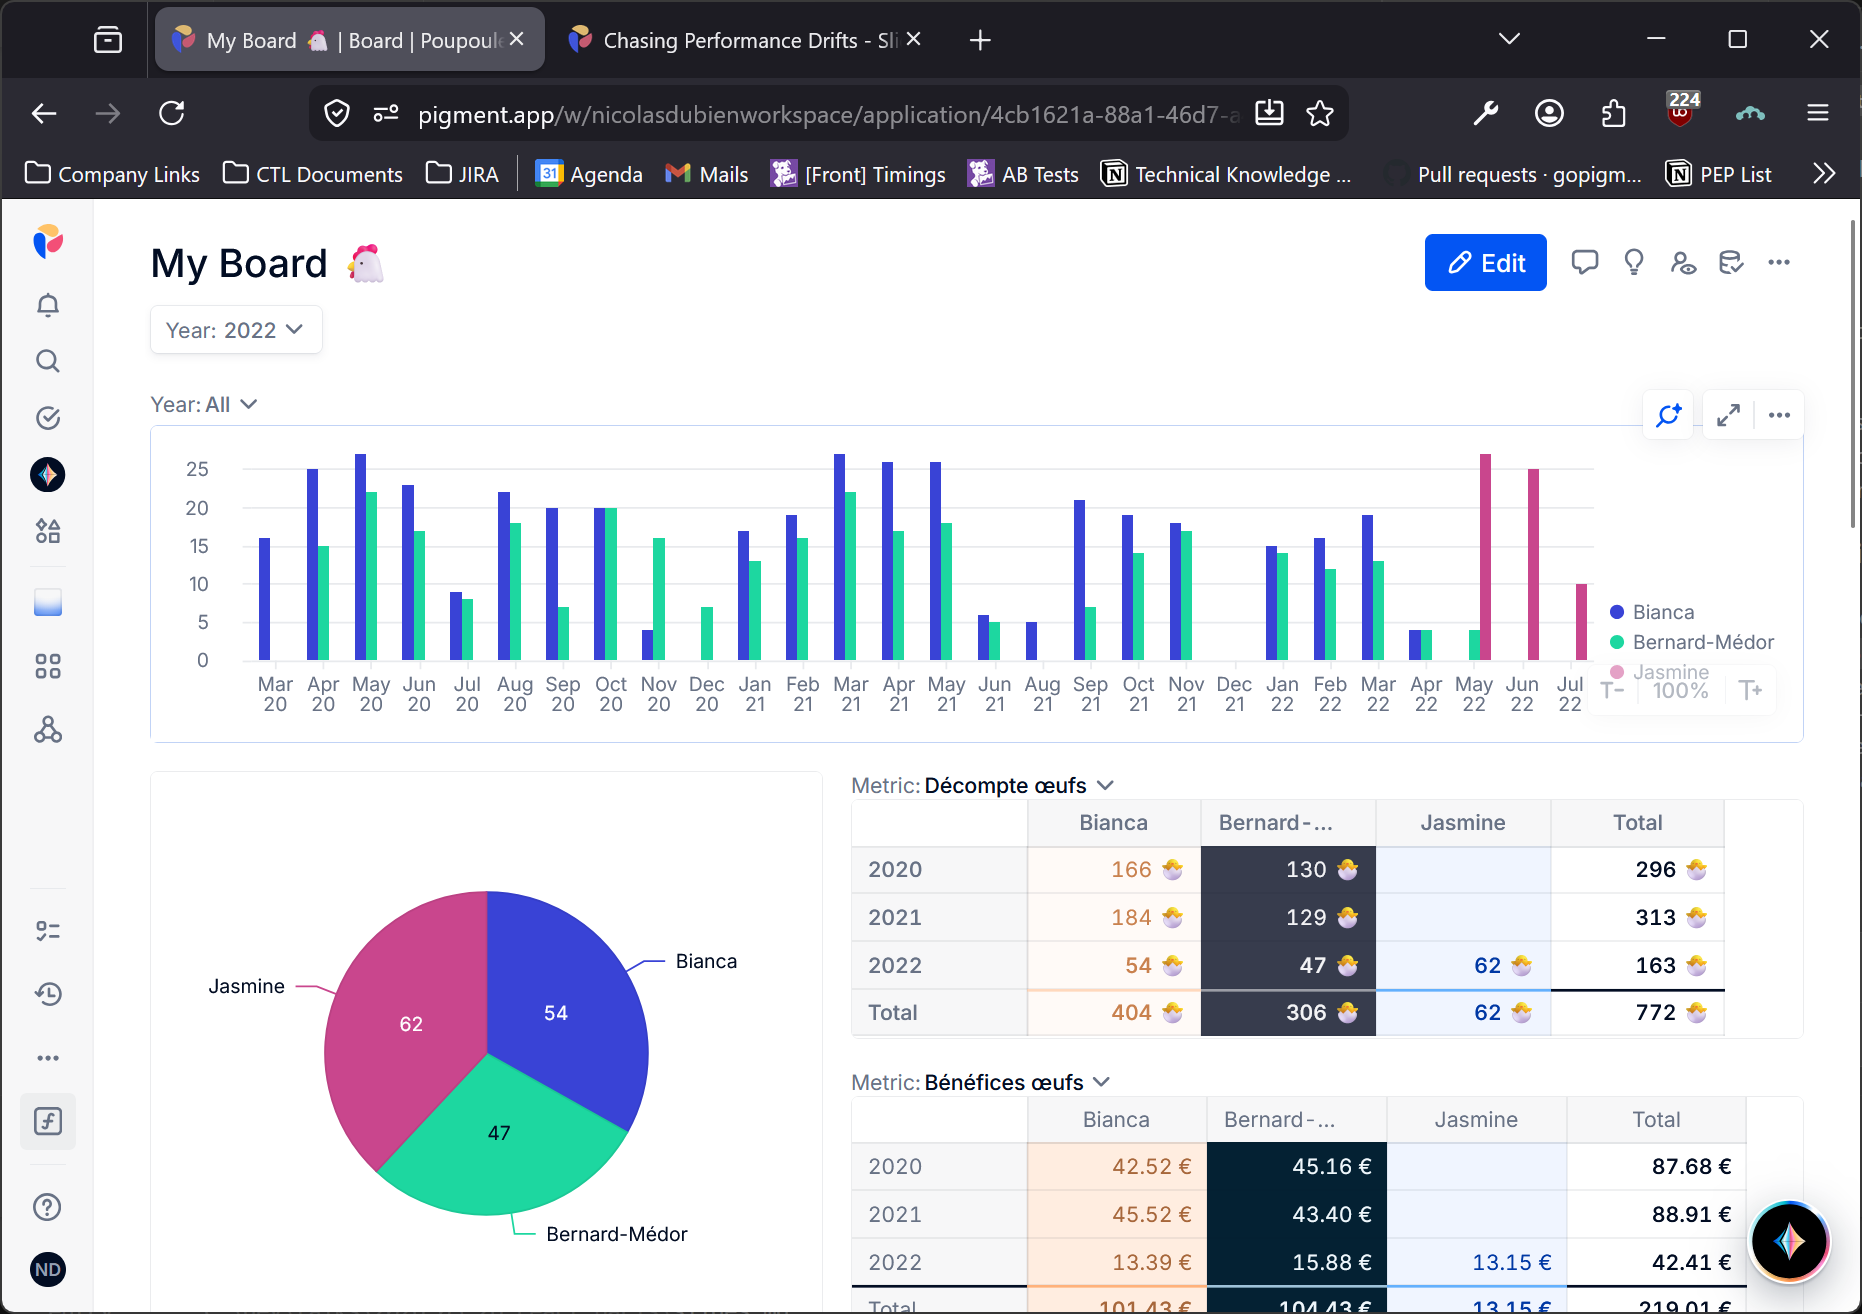
At Pigment, we are building a Business Planning platform. Part of that is visualizing data in what we call Boards: a single place mixing Grids, Charts and KPIs. Boards are also fully real-time: if a colleague updates data you're currently viewing, it triggers a partial reload for you.
From day one, Boards have been critical. This is where our customers spend their time, investigate and dig into their data. It cannot be slow so we always pay close attention to anything touching it. That said, even with careful attention, regressions crept in. That's what this article is about.
Before diving in: from the very start, our Boards have been optimized with virtualization for Grids and with smart partial reloads to avoid unnecessary recomputation of charts.
Out of memory
The report
It happened. A client reported that our UI was suddenly crashing. At the time, most usage was around 1,000 cells in the Grids. We dug in, tried to reproduce it... and couldn't. So we went back to the customer asking for more details. They reported an out-of-memory error and told us how they used the platform in their day-to-day: they opened a Pigment tab at the start of the week, left it running alongside many other tabs and came back to it later; by then, it had crashed.
That user flow gave us a crucial clue. Everything in Pigment is real-time: whether you're actively using it or not, it reloads itself whenever needed. At that time, we weren't cutting real-time updates even on hidden, unused tabs. But while that aggravated the problem, it wasn't the root cause. The real issue was that every render leaked a tiny slice of memory. We were registering event listeners and failing to clean them up, which caused leaks that pulled along surrounding values until the tab ran out of memory. We were leaking states of all our cells plus the entire DOM of a cell. With 1,000 cells, that adds up fast.
The problematic snippet was something like:
useEffect(() => {
  const callback = () => {};
  addEventListener("keydown", callback); // ⬇️ listener
  return () => removeEventListener("keyup", callback); // ❌ wrong event type
}, []);
Leaks are everywhere and most of the time invisible until they blow up your application.
Setting the trap
Finding and fixing the bug was one thing. Stopping there would have left the door open for the same class of regression to creep back in. So we looked for ways to prevent it.
A few options surfaced. Some were local: check that the event listener is properly removed by mocking handlers in a unit test. Others were more general: find a lint rule to catch these patterns. But none of them were enough. Leaking is easy and no tooling can catch every variant at the static analysis level. We needed something that could surface leaks on the actual user flow.
During our investigation, we found that the leak was retaining state from unmounted components. So we decided to track whether state from critical components was leaking. We came up with the following test flow:
- Open the app on the homepage
- Count the number of probed states
- Run a flow
- Go back to the homepage
- Count the number of probed states
In our case, the "Run a flow" was replaced by "Open a Board".
To track this, we instrumented key components. The instrumentation is only active in test context. In production, we replaced it by a no-op. All it takes is calling a new hook from our key components:
function ComponentName(props) {
  useLeakProber(); // no-op in Production
  //...
}
Under the hood, the hook stores a WeakRef to a piece of component state. Unlike a regular reference, a WeakRef doesn't prevent the garbage collector from reclaiming the object. So if all strong references to the state get removed, it gets collected and ref.deref() returns undefined. In case of a leak, the state stays alive and deref() still returns the object. That's the signal we count.
Here is a simplified version of our useLeakProber:
const probes: WeakRef<object>[] = [];

function useLeakProber() {
  const [probe] = useState(() => ({}));

  useEffect(() => {
    probes.push(new WeakRef(probe));
  }, [probe]);
}

window.countActiveLeaks = function countActiveLeaks() {
  return probes.filter((ref) => ref.deref() !== undefined).length;
}
With the helper in place, we could start using it. Our take was that neither unit nor integration tests were enough for memory leaks. They can catch specific cases we've already identified, but they're too narrow to surface unknown leaks. So we went for end-to-end tests. Cypress was the de facto choice in the industry at that time and it was ours too. The test looked like this:
describe("No leak", () => {
  it("should not leak", () => {
    login();
    visitHome();
    countLeaks().then((leakCount) => {
      flow();
      visitHome();
      expectAtMostLeaks(leakCount);
    });
  });
});

function countLeaks() {
  cy.gc();
  return cy.window().then((window) => {
    window.gc?.();
    return window.countActiveLeaks();
  });
}

function expectAtMostLeaks(leakCount) {
  cy.gc();
  cy.window().should((window) => {
    window.gc?.();
    const activeLeaks = window.countActiveLeaks();
    expect(activeLeaks).to.be.at.most(leakCount);
  });
}
One subtle Cypress detail: .should retries the predicate until it either succeeds or times out. That's why we trigger the garbage collector inside it on every retry. This matters when dealing with memory: browsers prefer to grow the heap until they hit a limit rather than eagerly free it. Without explicitly triggering GC, leaked objects can hang around for hours even after they're no longer needed. Additionally calling GC once isn't enough as it may just flag memory as "to be freed later." The trick is to keep retrying until the count reaches our expectations. If it never does, you're still holding state in memory.
Adapted to our Boards, the test was simply:
describe("No leak", () => {
  it("should not leak when browsing a Board", () => {
    login();
    visitHome();
    countLeaks().then((c) => {
      visitBoard("board-xyz");
      visitHome();
      expectAtMostLeaks(c);
    });
  });
});
We tried it on a toy project and the probes stayed silent, even against a deliberate leak. It works in our stack, likely because we have a mix of React version, third-party libs and patterns like Suspense or lazy that create the right conditions for it. That was good enough for us to stop there. Worth trying in yours, but don't assume silence means no leak.
Sluggish keystrokes
The report
This ticket came up later. By then, clients had started using Pigment with much larger datasets. We had gone from Grids of 1,000 cells to Grids with 1,000,000. At that scale, small performance issues become very visible.
The report was simple: keyboard navigation felt slow. We loaded the client's data and reproduced it immediately. Part of why we hadn't caught it earlier: we'd always tested with developer-crafted, trimmed datasets and never against real data for many reasons including legal concerns.
By toggling on the React devtools we quickly spotted something that looked problematic: we were re-rendering all the cells anytime we changed the focused cell.
The fix itself was straightforward once we understood the cause. The selection state lived on the Grid component which wraps all cells so that every cell could read it. But by design, when a React component's state changes, it re-renders itself and all its descendants. We were triggering that on every keystroke, touching thousands of cells at once. In React 16, that's a fully synchronous operation that blocks the main thread until the entire subtree is traversed. Newer React with concurrent rendering would have avoided the main-thread block, but the display would still have felt laggy.
The fix: move the selection state outside of React to a mechanism that React doesn't control.
Setting the trap
As with the first issue, we wanted to make sure this couldn't quietly come back. The specific trigger was user selection, but the pattern is general: any feature that tracks per-cell state faces the same risk. Our strategy:
- Count the number of renders
- Run a flow
- Count the number of renders
Same as before, we added a new hook, called from key components:
const renderCount = new Map<string, number>();

function useRenderCount(kind: string) {
  useEffect(() => {
    renderCount.set(kind, (renderCount.get(kind) ?? 0) + 1);
  });
}
With the hook in place we were able to shape a generic implementation for re-render tests:
describe("No unwanted re-render", () => {
  it("should not re-render", () => {
    login();
    visitPage();
    resetRenderCounters();
    flow();
    expectRenderCount("kind-a", countA);
    // And maybe others: expectRenderCount('kind-b', countB);
  });
});

function resetRenderCounters() {
  cy.window().then((window) => {
    window.renderCount.clear();
  });
}

function expectRenderCount(kind, count) {
  cy.window().should((window) => {
    const observedCount = window.renderCount.get(kind);
    expect(observedCount).to.be.eq(count);
  });
}
Applied to our specific case, the test was:
describe("No unwanted re-render on keyboard navigation", () => {
  it("should not re-render all grid when moving between cells", () => {
    login();
    visitGrid("grid-name");
    focusOnCell(0, 0);
    resetRenderCounters();
    pressArrowDown();
    expectRenderCount("cell", 2);
    expectRenderCount("header", 0);
  });
});
Slowdown on scroll
The report
Scale grew again. From millions of cells, we moved to billions. From one or two items per enum cells, we moved to millions. Not everything fit in memory anymore, so we introduced lazy loading and started to fetch only the data at display time for large datasets.
A client reported something interesting: the more they scrolled their Grid, the slower it got. Investigating, we traced it to our data cache. Our algorithm inserted new entries one at a time with a linear scan. While scrolling, we weren't inserting one entry but many. The result: a quadratic slowdown that got worse and worse the more data was already loaded.
The fix was to batch the insertions.
Setting the trap
Once again, fixing it wasn't enough. We wanted to make sure it couldn't come back. So we built a dedicated test suite.
The concept: detect long tasks. A long task is any synchronous operation that blocks the browser's main thread for more than 50ms. Past that threshold, the browser can't process scroll events, keyboard input or animations, so users experience it as a freeze. Browsers expose long tasks through the PerformanceObserver API. There's simply no reason to hit one while scrolling a large dataset. So we built a test that sets up a large dataset in CI and fails if any long task is detected.
The detection was done using this snippet:
const longTasks = [];

const observer = new PerformanceObserver((list) => {
  for (const entry of list.getEntriesByType("longtask")) {
    longTasks.push(entry.duration);
  }
});
observer.observe({ entryTypes: ["longtask"] });
We quickly realized there was no reason to limit this check to the big-dataset test. Every test in our suite should be free of long tasks. So we made it a global afterEach:
describe("Any test", () => {
  afterEach(() => {
    expectNoLongTask();
  });

  // The test
});

function expectNoLongTask() {
  cy.window().should((window) => {
    const observedCount = window.longTasks.length;
    expect(observedCount).to.be.eq(0);
  });
}
Takeaways
Chasing performance drifts is hard. We decided to complement reviews, unit tests, integration tests and linting with an extra layer: end-to-end tests tailored to performance. At Pigment, this layer is the last line of defense before a regression reaches production. Ideally we catch things earlier but each of the three patterns above has proven useful by catching regressions that slipped through everything else.
The underlying strategy is always the same:
- Measure something
- Run a flow
- Measure something again
In the first case, the measure was a memory proxy. In the second, a render count. In the third, the number of long tasks. This pattern won't catch everything as there are always new proxies to add. But it gives a simple and reusable safety net that's easy to reason about and extend.
If this is the kind of challenge that grabs your interest, we should talk! We're always on the lookout for talented engineers to join our teams.
Watch the talk
This article is a written version of a talk we gave at the React Paris conference in 2026.